


Analysis of Compound, Uniswap Pools, TokenSets, ETH and BTC
Key Takeaways:
- DeFi applications have provided significant risk-return improvements for investors over the past year
- TokenSet’s ETH 20-Day MACO outperforms ETH buy-and-hold in returns while significantly reducing drawdowns
- Compound and Uniswap offer attractive yield opportunities for investors holding stablecoins
The decentralized finance ecosystem has become one of the most active on Ethereum over the past year. Compound, Uniswap and TokenSets are some of the most commonly sought after investment options, for which we provide an in-depth analysis here. The blockchain’s native cryptocurrency, Ether, is the main collateral asset used for these financial applications. There is currently over 3m ETH worth of assets (over $500m of value) locked in various DeFi applications (more statistics on DeFi Pulse).
This post compares the performance of Compound cDAI, Uniswap’s DAI-ETH pool, and TokenSets’ ETH MACO against the baseline of ETH and BTC in the last 11 months.
We analyzed the returns of lending DAI on Compound, supplying liquidity to Uniswap’s DAI-ETH pool, or investing in TokenSets’ ETH 20-Day and 50-Day Moving Average Crossover Strategies from the 3rd of December, 2018 until the 31st of October, 2019. We also present the returns for Ethereum and Bitcoin buy-and-hold strategies for the same period. This analysis does not account for trading fees, slippage, or stablecoin price fluctuations.
With several live DeFi applications and new ones being developed, Zerion enables investors to track and manage their portfolios across many protocols. You can connect directly with your wallet or select an Ethereum address to watch. Try this address as an example.
Compound Returns
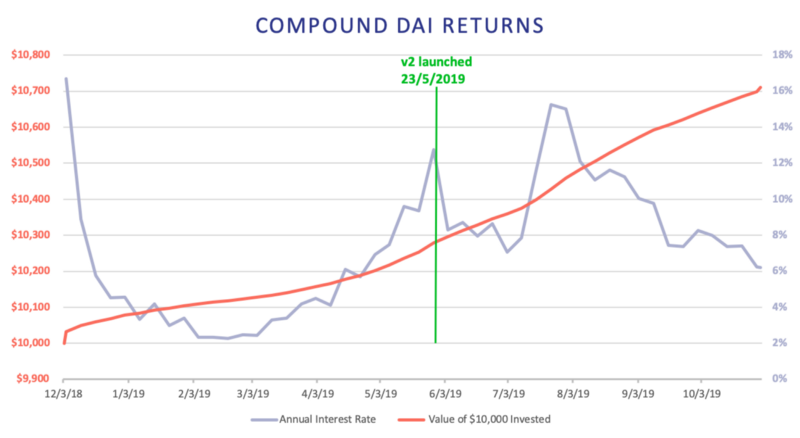
Compound is a money market protocol which allows users to pool assets which can then be borrowed after providing collateral. Interest rates are variable and dependent on supply and demand.
For Compound, we present the performance of a 10,000 DAI portfolio and the annualized interest rates for each week. In addition to Compound, DeFi projects like dYdX v2, Dharma, bZx, and Nuo have offered similar returns for DAI, but have been excluded because they only went live during 2019.
From December 2018 until the end of October 2019, Compound earned a 7.1% return. Most notably, interest rates started increasing in March 2019 following MakerDAO’s stability fee increases. Lower interest rates on other collateralized debt protocols attracted users to move their positions to take advantage of more favorable rates. We do not account for DAI price variation, but over this period the price of DAI/USD was in the range of 0.95−1.02. In December, the Compound Protocol was not fully functional for several hours as the team deployed a patch to fix a bug in the liquidation process, which had no negative consequences for any users.
Uniswap Pools Returns
Uniswap is an on-chain exchange that users can use to trade tokens. Trades are matched from asset reserves supplied by liquidity providers, who can earn returns on trading fees.
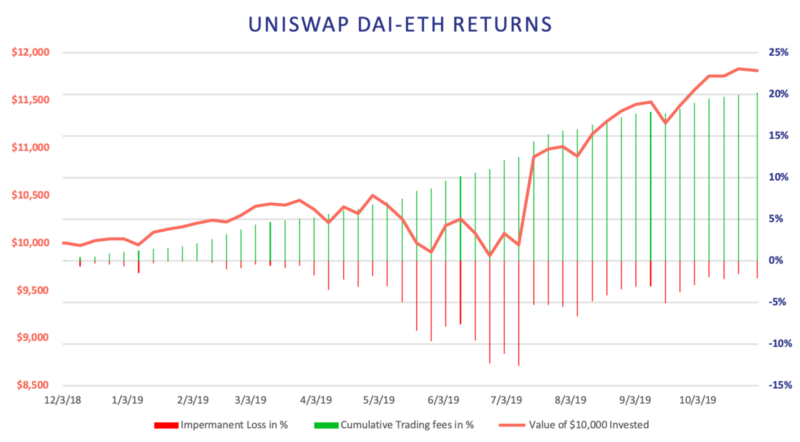
We present the performance of $10,000 supplied into the DAI-ETH pool on Uniswap. In practice, this means that the investor supplies $5,000 worth of ETH and $5,000 worth of DAI into the pool. These figures are for an investor who supplied the assets on the 4th of December, 2018 and stayed in the pool until the 31st of October, 2019. The returns would vary for investors who provided liquidity at different times due to different ETH/DAI prices. Over the period, the Uniswap DAI-ETH pool earned a 18.15% return.
Realized Uniswap returns are dependent on three factors: 1) asset prices when supplied and withdrawn, 2) liquidity pool size, and 3) trading volumes. The high volatility of crypto prices translates to highly variable Uniswap returns so future returns can be expected to vary greatly from the presented figures.
In the figure below, the green columns show the weekly cumulative trading fees and the red columns show the weekly impermanent loss resulting from price volatility. Interestingly, the fees collected from increased trading activity on days of large ETH price volatility greatly mitigated the impermanent losses on the total value of the portfolio. Another factor contributing to this result is the relatively small liquidity pool size compared to the trading volume, which allowed liquidity providers to receive a large share of the fees. If the liquidity pool sizes had been larger, trading volumes lower, or both, investors would have realized greater (net) losses on the days of large ETH price volatility due to receiving a smaller share of fee revenues. Ultimately, the strategy was only slightly below its original value during 5 weeks.
TokenSets: ETH 20-Day and 50-Day Moving Average Crossover Strategies
TokenSets are tokenized trading strategies where the strategy is executed automatically without the user having to perform any actions.
We present the performance of two trend trading strategies: the 20-Day Moving Average Crossover (MACO) and 50-Day Moving Average Crossover. Both are simple momentum strategies aiming to capture returns from persisting trends and rebalancing to cash when those trends reverse.
TokenSets released their Trend Trading Strategies in July 2019, but we approximate returns for the strategies using daily price data since October 2018. It should be noted that our analysis does not account for fees and slippage, but recent TokenSet rebalancing events have incurred slippage of 0.5% or more, and depending on the frequency of rebalances, these may affect the real performance of the strategies.
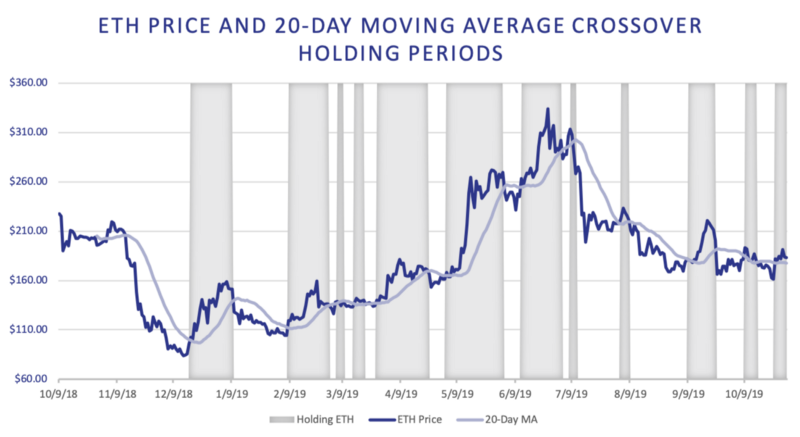
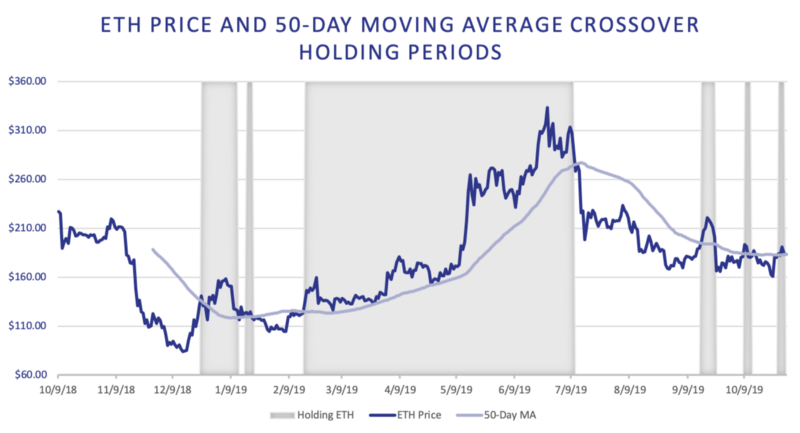
The moving average crossover strategy buys and holds ETH when the price of ETH is above the moving average, and sells ETH and holds stablecoins when the price is below the moving average. The rebalancing transactions occur on the day of a price crossover with the condition that 4 days have passed since the last rebalancing.
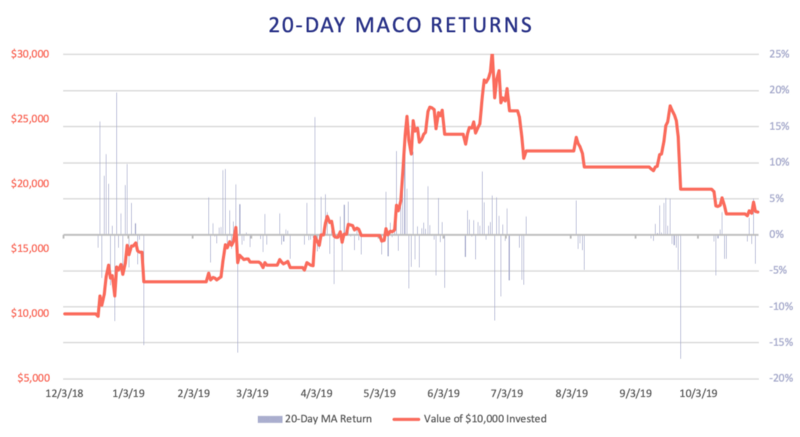
The 20-Day MACO strategy outperforms the ETH buy-and-hold strategy by generating a 78.7% return.
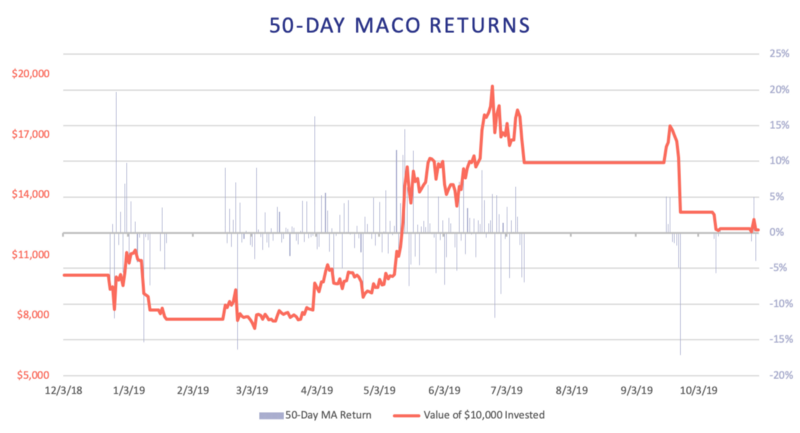
We note that both strategies mostly avoided ETH’s drawdown in July 2019 by rebalancing into stablecoins in time. However, September’s drawdown was too sudden and both rebalanced into stablecoins too late. The 20-Day MACO strategy outperforms the ETH buy-and-hold strategy by generating a 78.7% return, but the 50-Day strategy significantly underperforms with a 22.5% return. The blue bars represent daily returns.
Ethereum and Bitcoin Returns
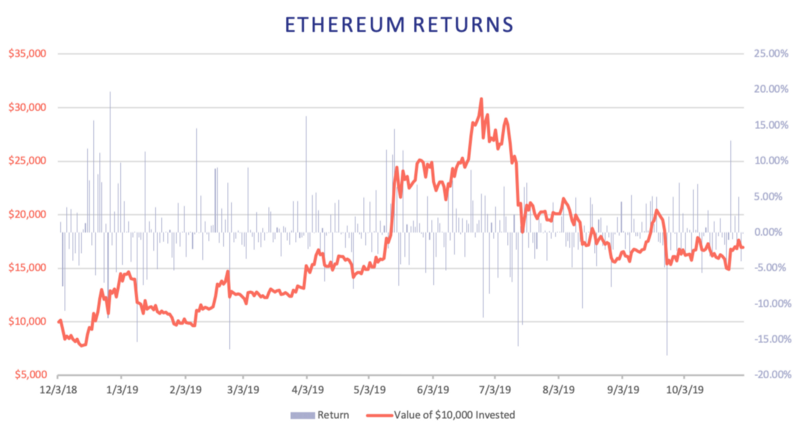
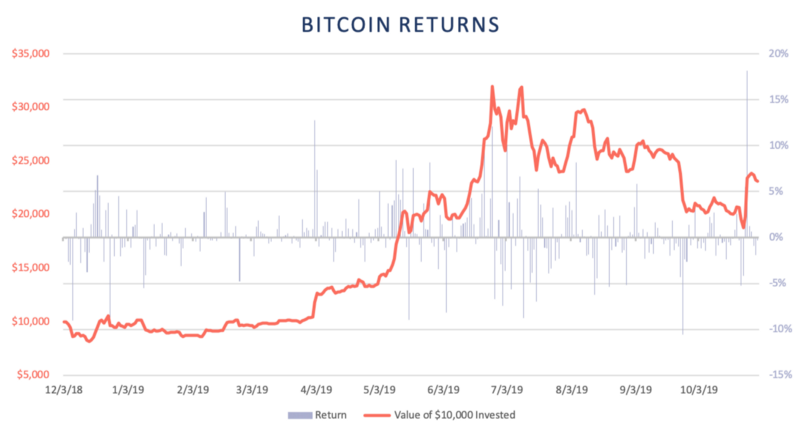
Ethereum and Bitcoin prices have remained highly correlated and their performance was largely comparable until July 2019 when Ethereum started an extended downward trend while Bitcoin recovered. However, Bitcoin followed in September 2019 when it also saw a large drawdown. Over the period, both assets peaked at over 200% from their starting values. The price of Ethereum has fallen by roughly 50% from its peak whereas Bitcoin’s price has fallen by roughly 34%. At the end of the period, an Ethereum buy-and-hold strategy realized a 69.3% return and Bitcoin realized 131.4%.
The orange line shows the performance of a $10,000 investment and the blue bars represent daily returns. The calculations are based on daily price data.
Summary
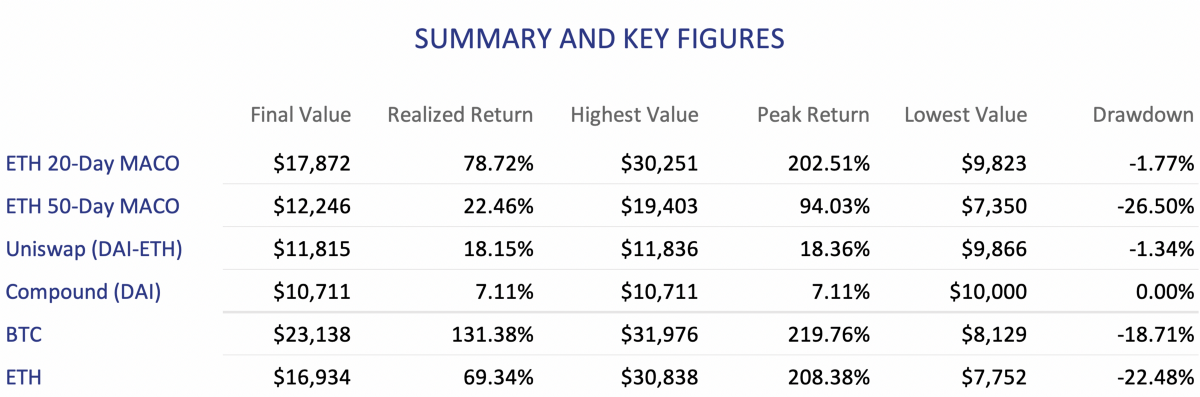
The ETH 20-Day strategy outperforms the other presented DeFi strategies and the ETH buy-and-hold strategy on an absolute basis. This results from the strategy avoiding most of ETH’s drawdowns while generating returns during the uptrends. The 50-Day strategy similarly captures ETH’s uptrend from March and rebalances into stablecoins in July, but experiences a large drawdown in September which significantly lowers the strategy’s final return. If the strategies had rebalanced faster (i.e. at the crossover price), the 50-Day strategy would have returned over 50%, and the 20-Day over 130%.
We also note the differences in return volatility and drawdowns. Most notably, the 20-Day strategy has a drawdown of only -1.77% from the original value compared to the drawdown of -26.5% for the 50-Day strategy, -22.48% for the ETH buy-and-hold, and -18.71% for the BTC buy-and-hold. However, holding ETH, BTC, or TokenSets carries higher risks due to price volatility compared to lending a stablecoin on Compound. Similarly, Uniswap’s DAI-ETH pool liquidity providers hold half of their investment in the stablecoin which also reduces the volatility of their portfolio.
Another interesting development in DeFi is the tokenization of investment positions. For example, Compound’s cTokens represent a deposit and its accrued interest but exist as a separate token. This means that the Compound deposit can be transferred and deposited into other smart contracts, like Uniswap (a cDAI-ETH pool exists). cDAI-ETH liquidity providers therefore earn both Compound’s DAI interest rate and the trading fees from the pool. Similarly, TokenSets could rebalance into cToken stablecoins, like cDAI or cUSDC, so investors could earn an interest rate on their cash positions.
As our analysis shows, the DeFi space allows investors with different risk-return profiles to seek out promising opportunities. Because of the open and decentralized nature of DeFi, the space will likely keep coming up with exciting new financial products, as the advent of tokenized positions shows, and it is (literally) worth staying on top of the newest developments.
Zerion
Note on the risks
DeFi is still in its early stages of development and all smart contract systems should be considered experimental and highly risky with the possibility of complete loss of funds. Risk frameworks aiming to create a standard are already under development (read more on the risks in DeFi and DeFi score).
In conclusion, investors may be better off diversifying their lending and other activities across many smart contracts rather than optimizing for the highest interest rates currently.
This report is not investment advice.
Thanks to Vekil Pantchev for the research on the returns and compilation of the results in this article.
Special thanks to Calvin Liu of Compound and Inje Yeo of Set for comments and suggestions. Additionally, Mikhail Melnik for maintaining the returns source for Uniswap and Adrian Stein for the comments on style.


